Learning how to analyze programs and kernels with perf
Overview
One of the tools that seemed useful but wasn't used is perf. This time, let's learn the basics of using perf.
Goal
- Analyze a application using
perf. - Attempt to create a flamegraph because it seems possible.
- Investigate if there is anything usable in a GUI.
Preparation
perf and related packages
Install the necessary packages. If only perf is needed, it can be installed with the following:
sudo pacman -S perf
For Arch Linux, various tools are included in the linux-tools group, so it seems good to install them with:
paru -Sg linux-tools
Install the required packages for creating flamegraphs (available in AUR):
paru -S flamegraph
To analyze the kernel with perf, you need to change a kernel parameter called perf_event_paranoid.
This parameter controls access to performance events, and its default value is 2.
However, this prevents capturing kernel events, so we need to change it to -1.
FYI: Kernel Documentation - perf-security
cat /proc/sys/kernel/perf_event_paranoid
echo -1 | sudo tee /proc/sys/kernel/perf_event_paranoid
fio
In this article, we will use fio, a tool for taking I/O benchmarks, as a test application.
sudo pacman -S fio
While researching how to use fio, it was found that there is a configuration item called ioengine.
To see how the behavior changes when this ioengine is changed, we will analyze it with perf.
By the way, looking at the man page for fio reveals that there are many different ioengine options that can be configured.
FYI: fio Man Page
Although there is no particular preference, we will try libaio, sync, and mmap this time.
Memo about perf
- Use
perf statto display metrics such as execution time and CPU usage.- For example, the result when running
pwdis shown below:% perf stat pwd
/home/mori/workspace/perf
Performance counter stats for 'pwd':
1.83 msec task-clock:u # 0.161 CPUs utilized
0 context-switches:u # 0.000 /sec
0 cpu-migrations:u # 0.000 /sec
67 page-faults:u # 36.526 K/sec
317,835 cycles:u # 0.173 GHz
232,109 instructions:u # 0.73 insn per cycle
52,250 branches:u # 28.485 M/sec
3,235 branch-misses:u # 6.19% of all branches
0.011358294 seconds time elapsed
0.000000000 seconds user
0.003322000 seconds sysbranch-missesrefers to failed speculative execution.context-switchesdoes not indicate the number of times the scheduler switches.- It remained 0 even with the
sleepcommand or a program usingpthread.
- For example, the result when running
perf benchprovides several benchmark tools.% perf bench
Usage:
perf bench [<common options>] <collection> <benchmark> [<options>]
# List of all available benchmark collections:
sched: Scheduler and IPC benchmarks
syscall: System call benchmarks
mem: Memory access benchmarks
numa: NUMA scheduling and MM benchmarks
futex: Futex stressing benchmarks
epoll: Epoll stressing benchmarks
internals: Perf-internals benchmarks
breakpoint: Breakpoint benchmarks
uprobe: uprobe benchmarks
all: All benchmarks- For detailed program analysis, use
perf recordand view the results withperf report.- When you run
perf record, the results are saved in a file calledperf.data(can be changed with the-ooption). - You can specify events with the
-eoption; check the available events withperf list. - Adding the
-goption allows you to obtain a call graph, which is necessary for creating a flamegraph later. - Use
perf report -iwith theperf.dataobtained fromperf recordto display the results.
- When you run
perf topis similar to a real-timeperf report.perf scriptoutputs the results ofperf recordas a script.- It shows timestamps, event names, and event details.
- Flamegraphs are created based on this script.
- Use
perf annotateto annotate assembly code. perf diffis used to compareperf.datafiles.- It can be used to verify the effects when making performance improvements.
perf kvmis used to profile KVM.- You can use
perf kvm --guest recordto profile the guest machine, but I had trouble getting it to work, so I'll look into it later.
- You can use
Example
Let's use perf to analyze fio.
The command to capture the perf.data is as follows:
perf record -o /tmp/perf_libaio.data -g fio configs/seq_read_libaio.ini
To create a flamegraph from the obtained performance data:
perf script -i /tmp/per

f_libaio.data | stackcollapse-perf.pl | flamegraph.pl > images/perf_libaio.svg
Note: Be sure to include the -g option when recording with perf record to obtain the call graph.
Flamegraphs for changing the ioengine to libaio, sync, and mmap respectively:
libaio:

sync:

mmap:

There are many parts marked as "unknown," but this can likely be resolved by building fio with debugging information.
For a more thorough investigation, consider rebuilding and using tools like flamegraphs, perf report, and perf diff to examine the differences and confirm improvements when making changes.
Other Tools
A relatively recent tool discovered is hotspot, a tool for displaying perf results in a GUI, supporting flamegraphs as well.
(Found in AUR for Arch, but encountered a build error when attempting to install)
A tool introduced on Qiita while researching perf.
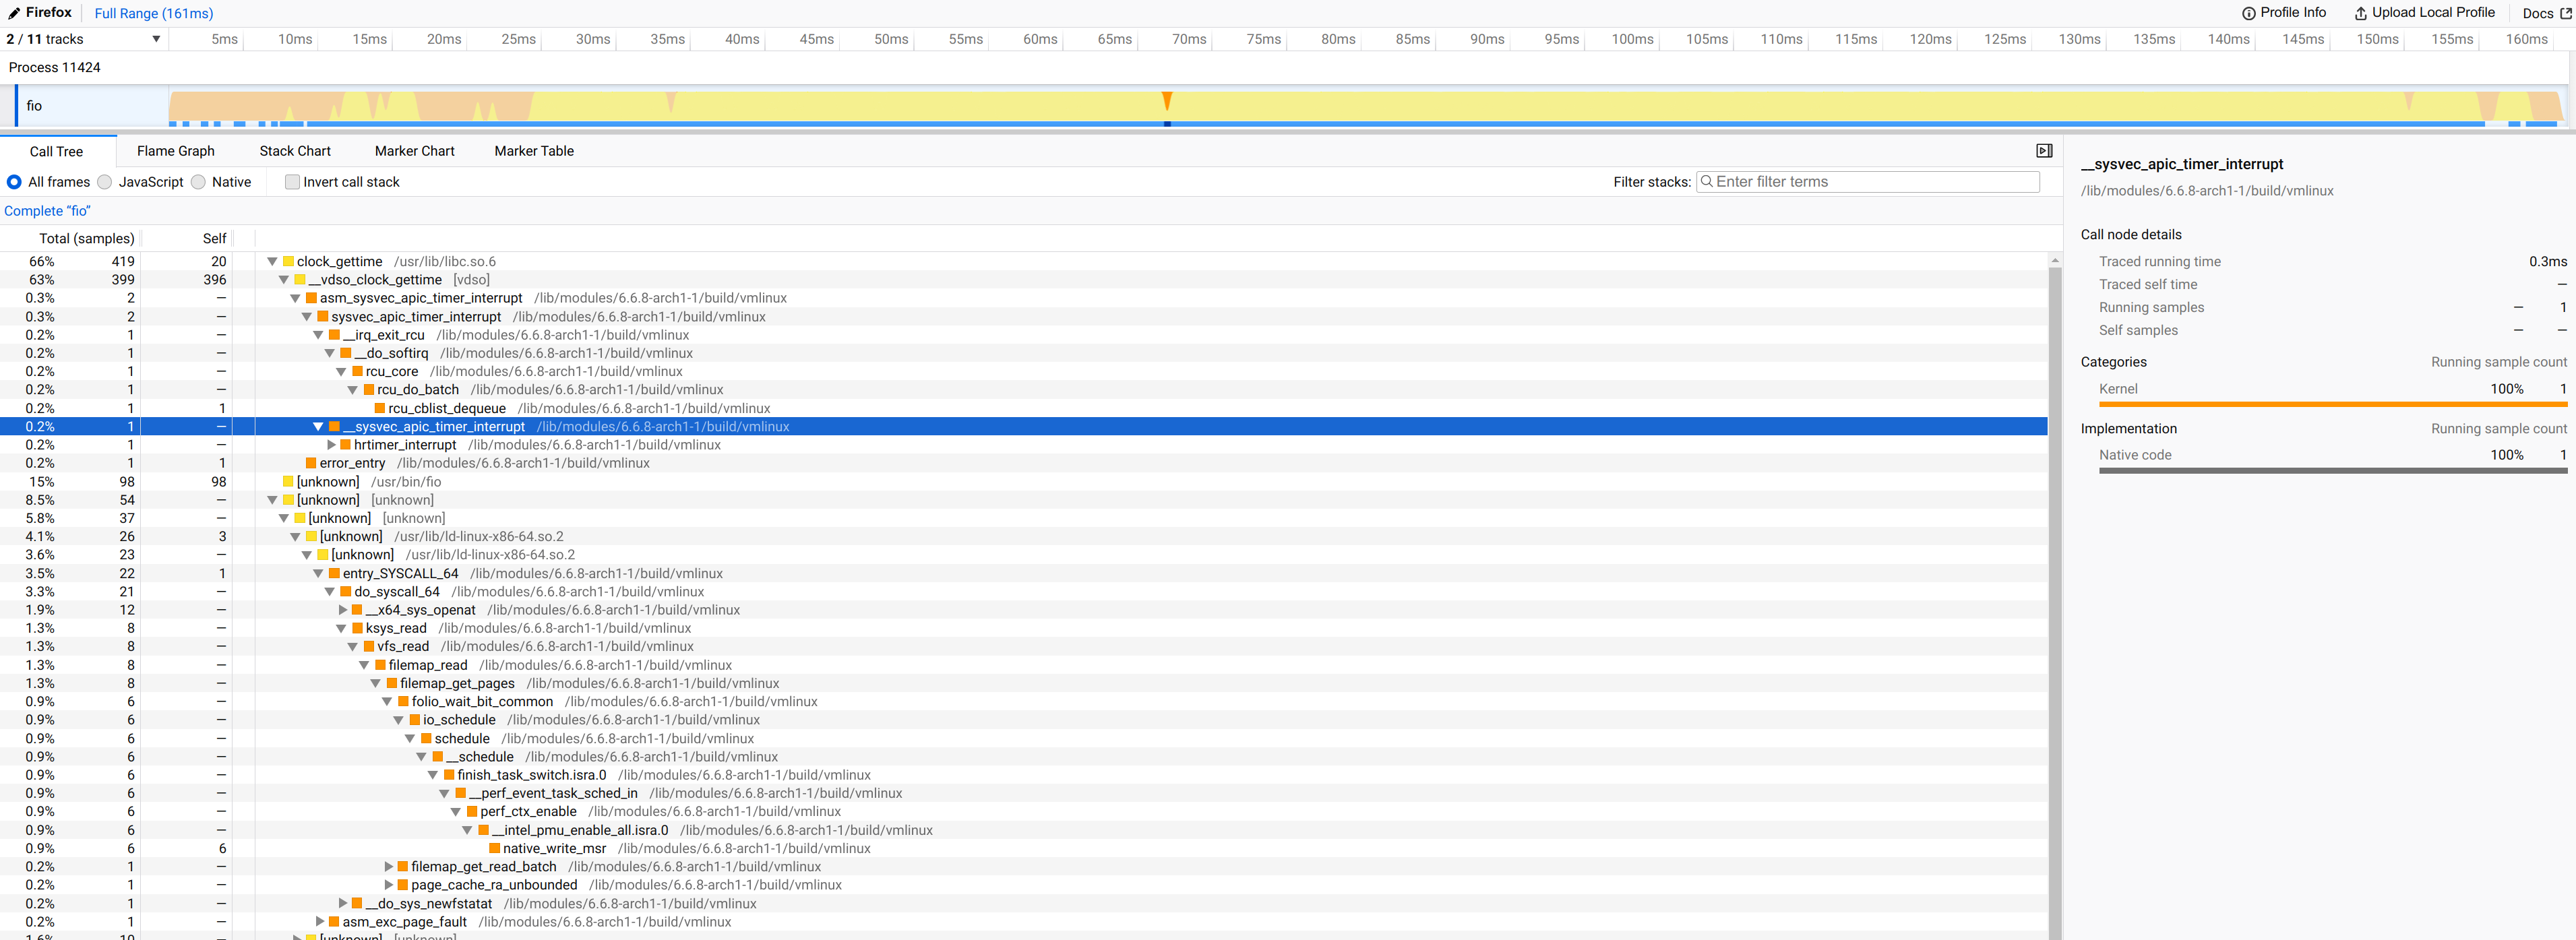
When you upload the test.perf obtained with the following command, the results are displayed as shown in the image below:
perf script -i /tmp/perf_libaio.data -F +pid > test.perf
Wrap Up
It seems beneficial to actively use perf when investigating bottlenecks or obtaining hints for improvements due to OS updates or application updates.